
Claims & damage assessment
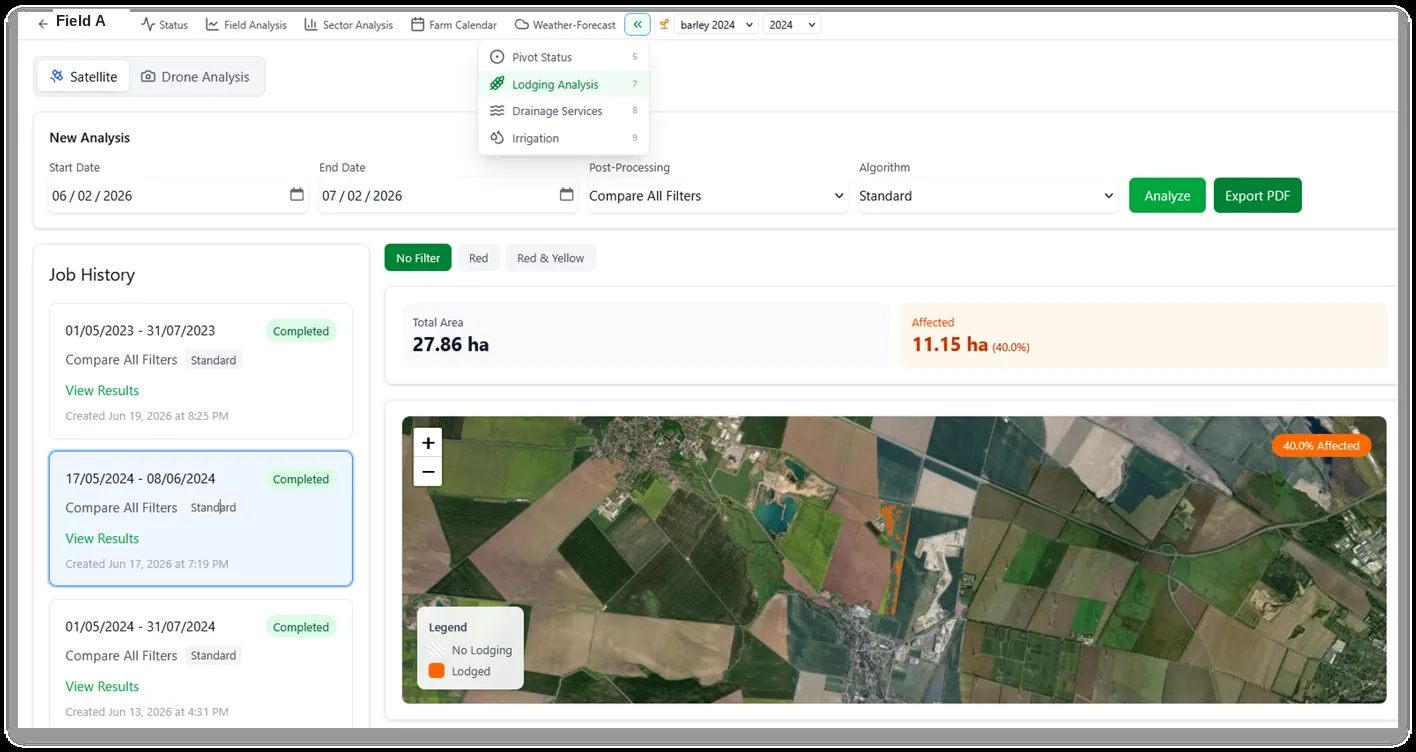
The affected area of an insured field, delineated automatically and returned as hectares with a severity breakdown. No field visit, no waiting for clear skies.
For crop insurers
No loss adjustment team can be in a hundred places at once, and qualified adjusters are getting harder to find every season. OMEGA measures the damage from above and returns it as hectares you can settle on — within days, and regardless of cloud cover.
The same analysis settles a claim after the event, prices the risk before the policy is written, and warns the farmer while there is still time to act.
The affected area of an insured field, delineated automatically and returned as hectares with a severity breakdown. No field visit, no waiting for clear skies.
A multi-season damage history and a risk score for any field, available before you write the policy. Field-level assessment instead of a postcode average.
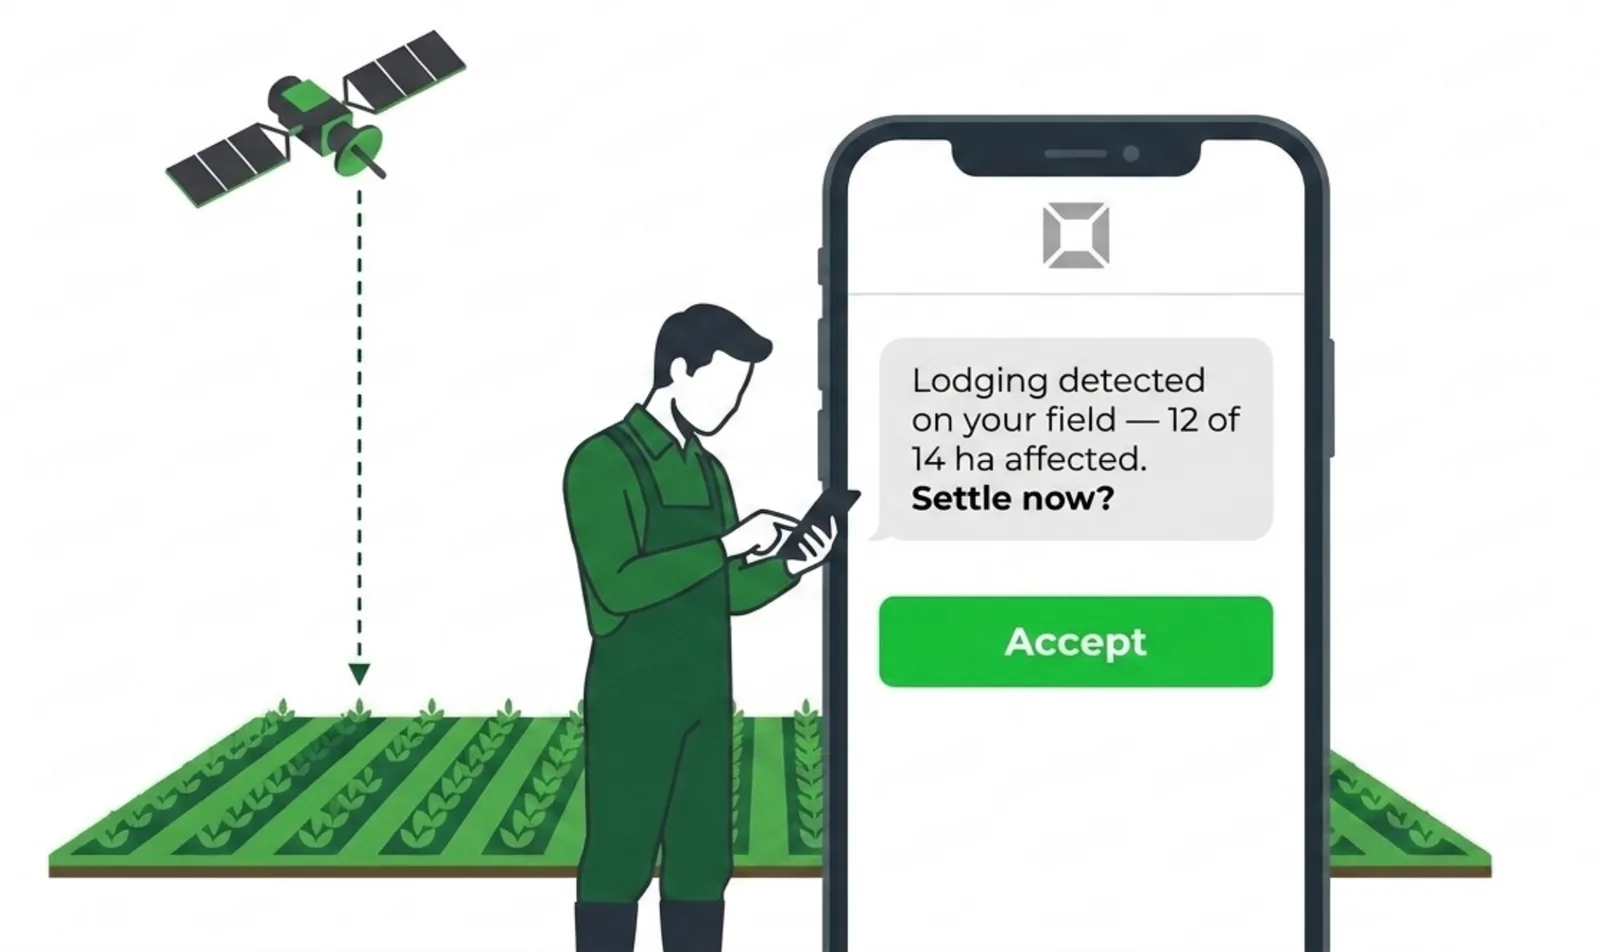
Early warnings delivered to the policyholder by SMS or messaging, through your existing relationship. No login, no app, no onboarding on the farm side.
Upload a shapefile or draw the field in the browser. The affected area comes back as a number you can put in the file, delineated across the whole field rather than sampled from a few representative spots.
Results are time-resolved, so you can also see whether a loss came from one event or accumulated across several — the question that usually decides a disputed claim.
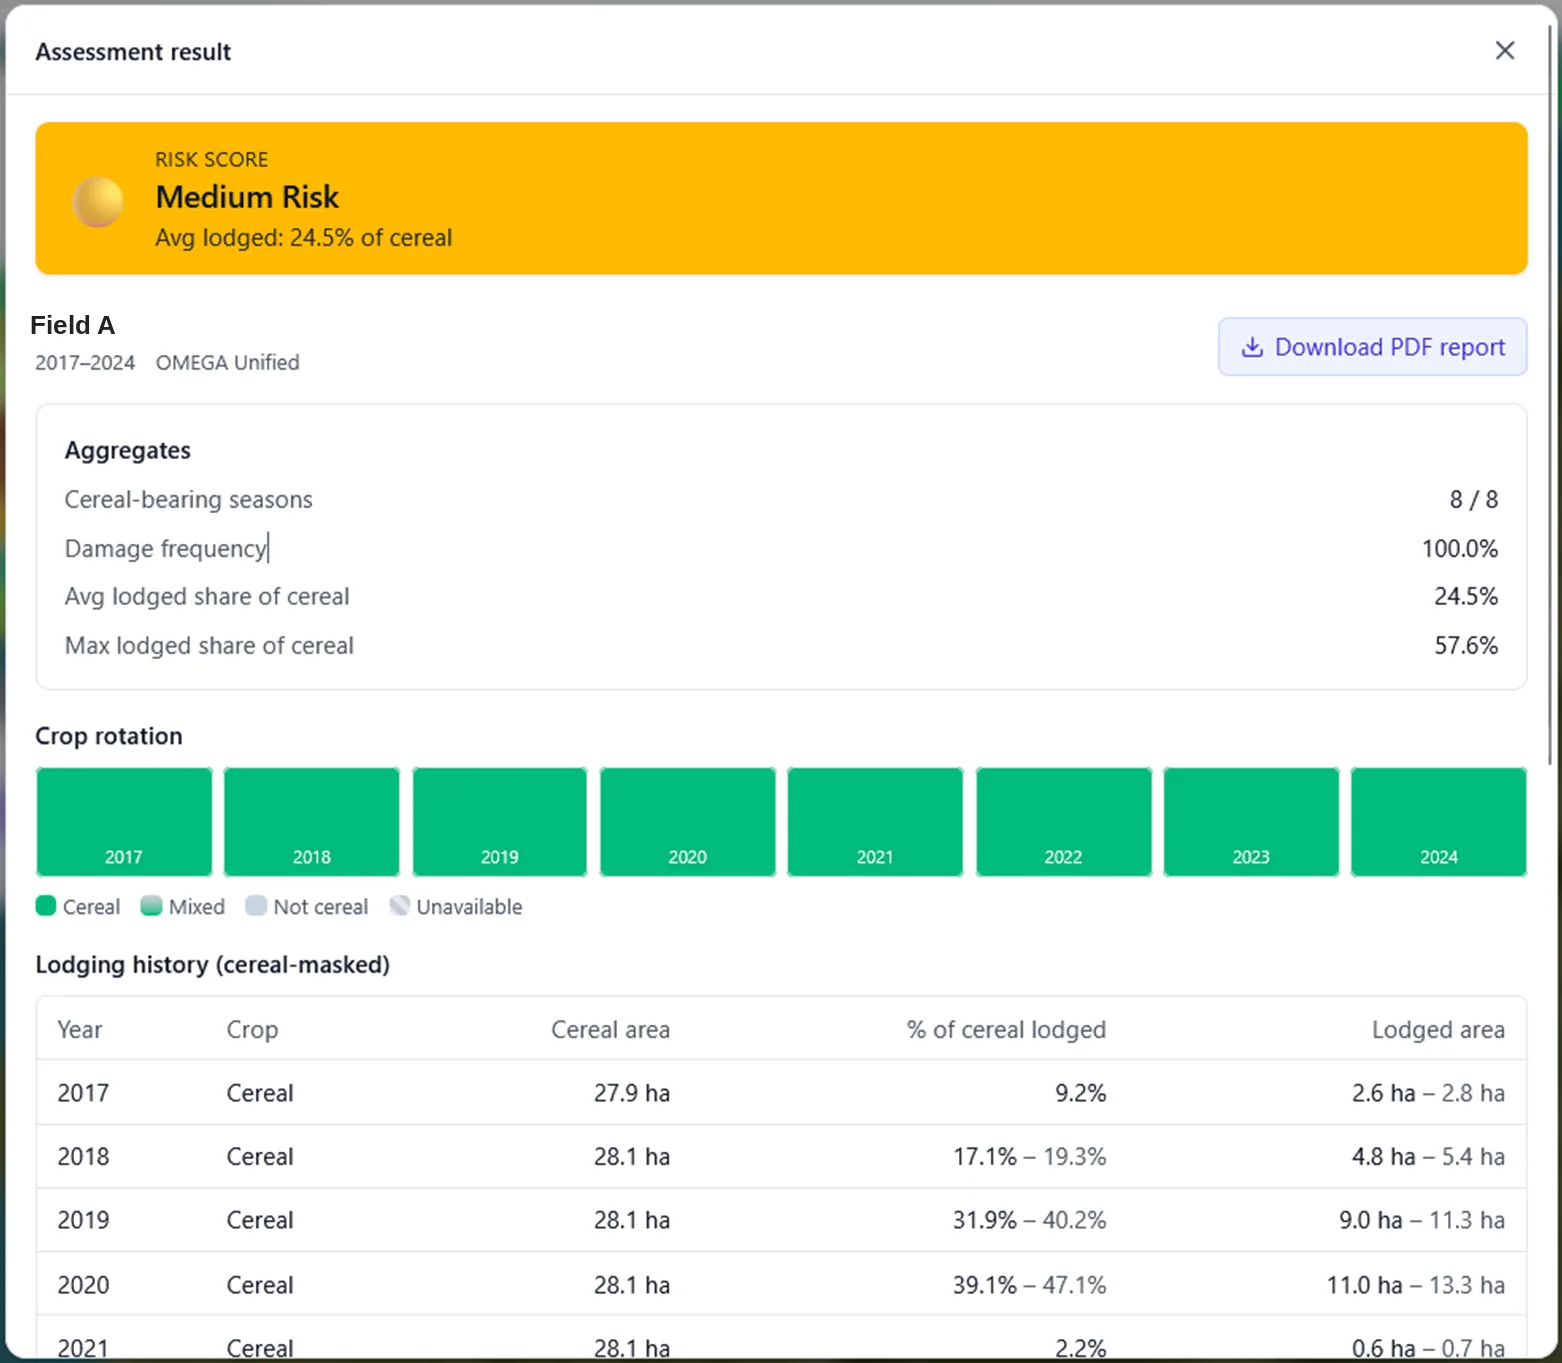
Tariffs are set by postcode because nothing more granular has been available. We produce a per-field record instead: which crop was grown in each past season, how often damage occurred, and how much of the field it affected.
A field that has been damaged in most of the last several seasons prices differently from its neighbour. That is the health report before you sign, not after the first loss.
Once a portfolio is on the platform, the value can be passed on to the policyholder — and it changes who makes the first call. Damage detected, settlement offered, before the farmer has walked the field.
Coverage depends on the peril, the crop and the region, and it changes as we release new capability. Rather than publish a list that is out of date by next season, we would rather look at your portfolio and tell you exactly what is measurable today, what we are working on, and what still needs someone in the field.
Ask about your portfolioThe question a supervisor asks is not whether the model is clever, but whether someone can reconstruct how a number was produced.
Every result we deliver keeps the inputs, dates and parameters it came from, so an assessment made today can be regenerated and defended in a year — by you, in front of your regulator, without us in the room.
One season and one selected portfolio is all it takes to find out.
Perils, region and fields — as a shapefile, or drawn online.
The current season plus past ones. First results within days.
Against your adjusters' assessments from settled claims.
Per-hectare pricing, staggered by volume, integrated into your workflow.
If you have coordinates from a damaged field, we can analyse it and show you the result. That is usually a faster conversation than a slide deck.
Start a pilot conversationOMEGA is incubated at ESA BIC Bavaria and supported by EIT Food. Patent filing funded through WIPANO by the German Federal Ministry for Economic Affairs and Climate Action. Co-funded by the European Union.
OMEGA is incubated at ESA BIC Bavaria and supported by EIT Food. Patent filing funded through WIPANO by the German Federal Ministry for Economic Affairs and Climate Action. Co-funded by the European Union.